
Business as usual. Investing summed up in two charts.
The US Stock Market
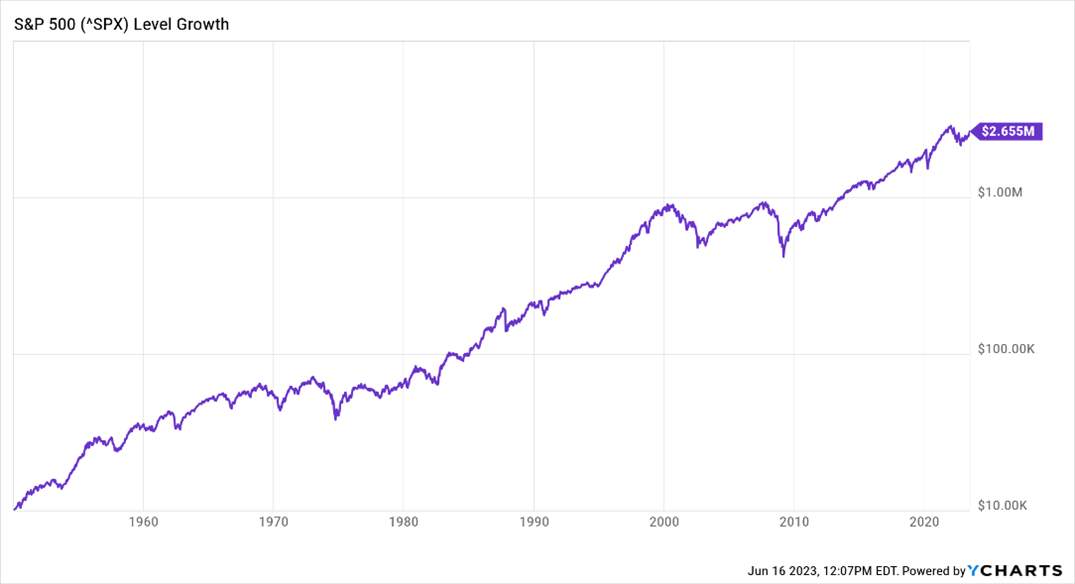
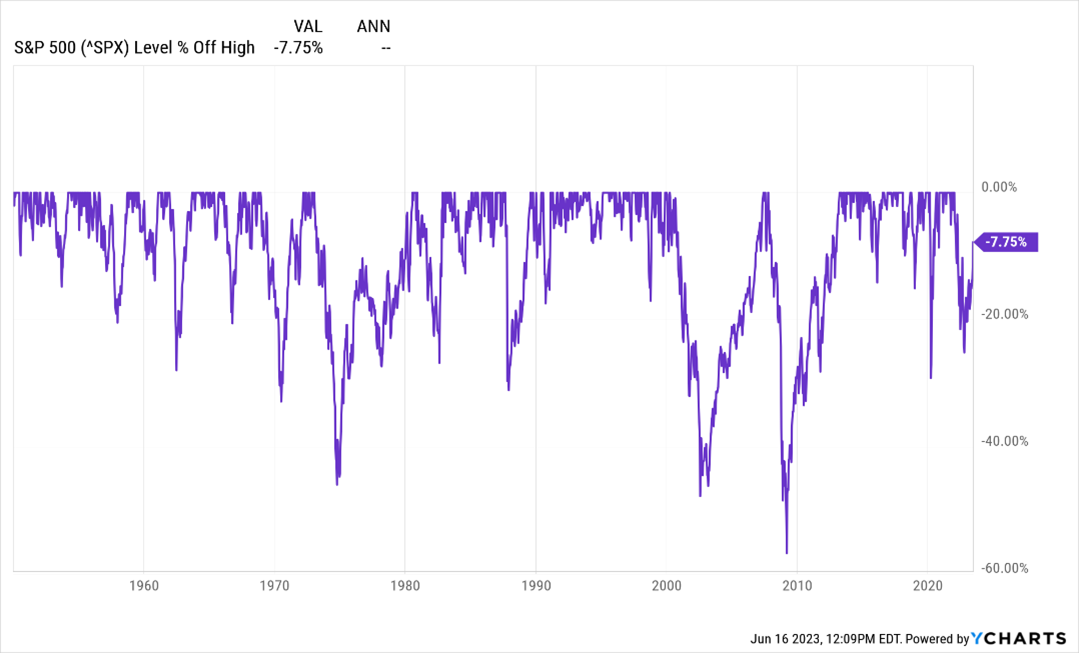
# 1 Growth of $10,000 and #2 Percent Below Previous All Time Highs
Source: Ycharts.com
Over time, the market has gone up. The first chart below indicates the growth of 10K invested in the S&P 500 from the time of inception to now. The numbers are pretty staggering.
Investing Looks pretty easy right?
Wrong. The market doesn’t go up in linear fashion. Looking at chart #2, you can visualize the drop of the market off of previuos highs. There are plenty of times the market was off by 20% of more from a previous high. If you have 500K invested, that is a 100K loss. That hurts. If you feel you need to sell your portfolio at that time, you might not be around when the market recovers and possible continues its march up.
Ever hear the phrase, two steps forward, one step back? The market is often gaining ground, only to give back previous gains. This is not unusual. This is Business as usual. However, depending on your perspective, or level of fear, you might only be focused on the recent downturns, forgetting the fact that over time the market has historically been a fabulous wealth generator.
Think about these two charts the next time the market falls, the news stories come out, and the fear sets in.
Wishing you investing success and ‘business as usual’
Tony
Securities and advisory services offered through LPL Financial, a registered investment advisor.
Member FINRA/SIPC.
The opinions and forecasts expressed are those of the author and may not actually come to pass. This information is subject to change at any time, based on market and other conditions and should not be construed as a recommendation for any specific security or investment plan. Past performance does not guarantee future results.”